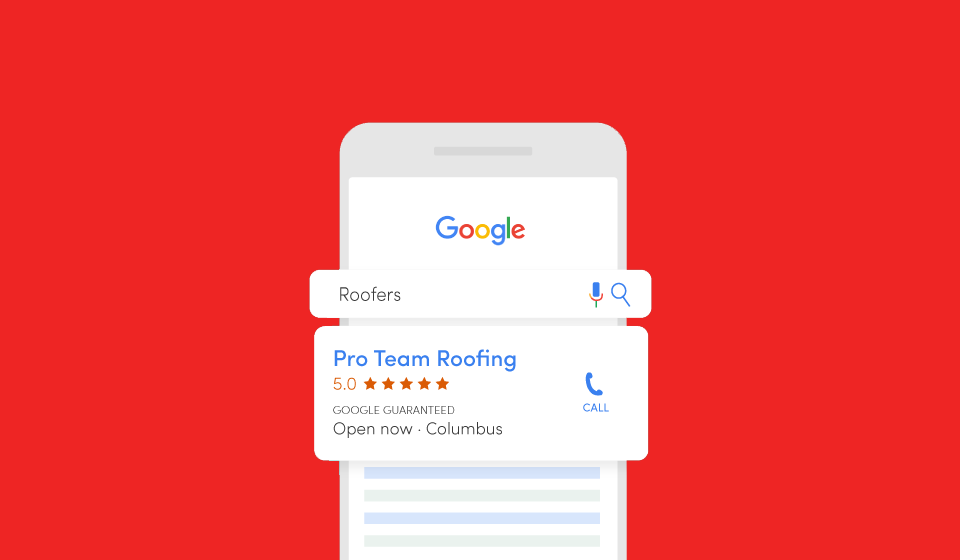
Ranking Factors: Google Local Service Ads
The #1 question we get about digital marketing for home services & professional services… “How can I scale my LSA?”. LSA = Google’s Local Service Ads (Google Guarantee). Why? LSA has a 10-20x channel ROAS for almost every client we have.

LSA of course uses a mix of factors when determining your rank:
- Your review score and the number of reviews
- Your proximity to a users’ location
- Responsiveness to customer inquiries and requests (basically answering the phone)
- Your hours
- Your budget
- Whether or not they’ve received serious or repeated complaints about your business (because, ya know, that guarantee will be costly to them if you mess up)
In typical Google fashion, they’ve updated their ranking factors several times over the years, and give you exactly 0 detail as to the weighting in factors. They did, however, open up their API to LSA within the last year, which allowed us a bit more insight.
We were one of the first agencies to pilot Google Local Service Ads, back in 2017 when it launched in Los Angeles as formerly Google Home Services. Needless to say, we have a plethora of aggregate data for accounts of all sizes and decided to run a correlation test to understand what Google does use to determine top 3 rankings.
Assuming clients are controlling the obviously controllable, and all budgets/hours/locations are already maxed out, we focused on the remaining visible ranking factors (since we have no visibility on “serious complaints” stats):
- Review Quantity
- Responsiveness
- Star Rating
So we extracted that data from the API for the last 4 years and focused on this year in particular as we saw shifts in correlating factors meaning Google has changed the weighting over the years. For instance, verified reviews used to hold more weight than GMB or unverified reviews, that is no longer the case per their product team.
The Highest Correlated Factors
We can see from the graphic, which is a pretty heatmap version of our correlation test results… Turns out, the aforementioned order is the order of importance, review count being the highest correlation coefficient value, aka the most correlated factor to high lead count, aka high ranking. Way over my head, but from what our data analyst tells me, 0.75 to 0.8 correlation coefficient value as significant value… Closer being more correlated, further being less.
The actual results order:
Makes sense right? You probably most often see the big guys with the most reviews showing in the LSA 3 pack. If the difference between you and the next guy is 1,000 reviews, that may sound overwhelming but I’d challenge you to reframe that perception… 1,000 reviews could be 3 per day if you have 10 techs, you’d hit it in <2 months working days. And the more you get, the more you’ll show, the more calls you’ll get… Compound this over time, you can show in the 3 pack more because Google sees you have higher review quality and are providing service excellence en masse.
If reframing the time it takes to attain the review count isn’t attainable enough… Imagine it in the context of potential revenue once you’ve reached the ever elusive 3 pack. When the $100/mo you’re spending now on LSA with a 10x ROAS (~$1,000 revenue), in a few weeks goes to $1,000/mo(~$10,000 revenue), and in a few months goes to $10,000/mo(~$100,000 revenue), all because you invested time in training + incentivizing your team to prioritize reviews.
If you have any questions on Google Local Service Ads or just want to talk shop, comment below or email me at brianna@adleverage.com ✉️


